
Home›Deliverability & technical›Deliverability rate
Email deliverability rate: how to measure and improve it
On this page
On this page
- Deliverability rate: definition and formula
- Deliverability and inbox placement: two rates that get mixed up
- How to measure your deliverability rate, tool by tool
- What drags the rate down, especially in B2B
- Action plan: raising a rate from 80% towards 99%
- Frequently asked questions about deliverability rate
In brief: The deliverability rate your platform reports counts the emails accepted by receiving servers, not the ones that reach the inbox. Here is how to calculate it, how it differs from inbox placement, which tools measure it and what to do when the rate starts slipping.
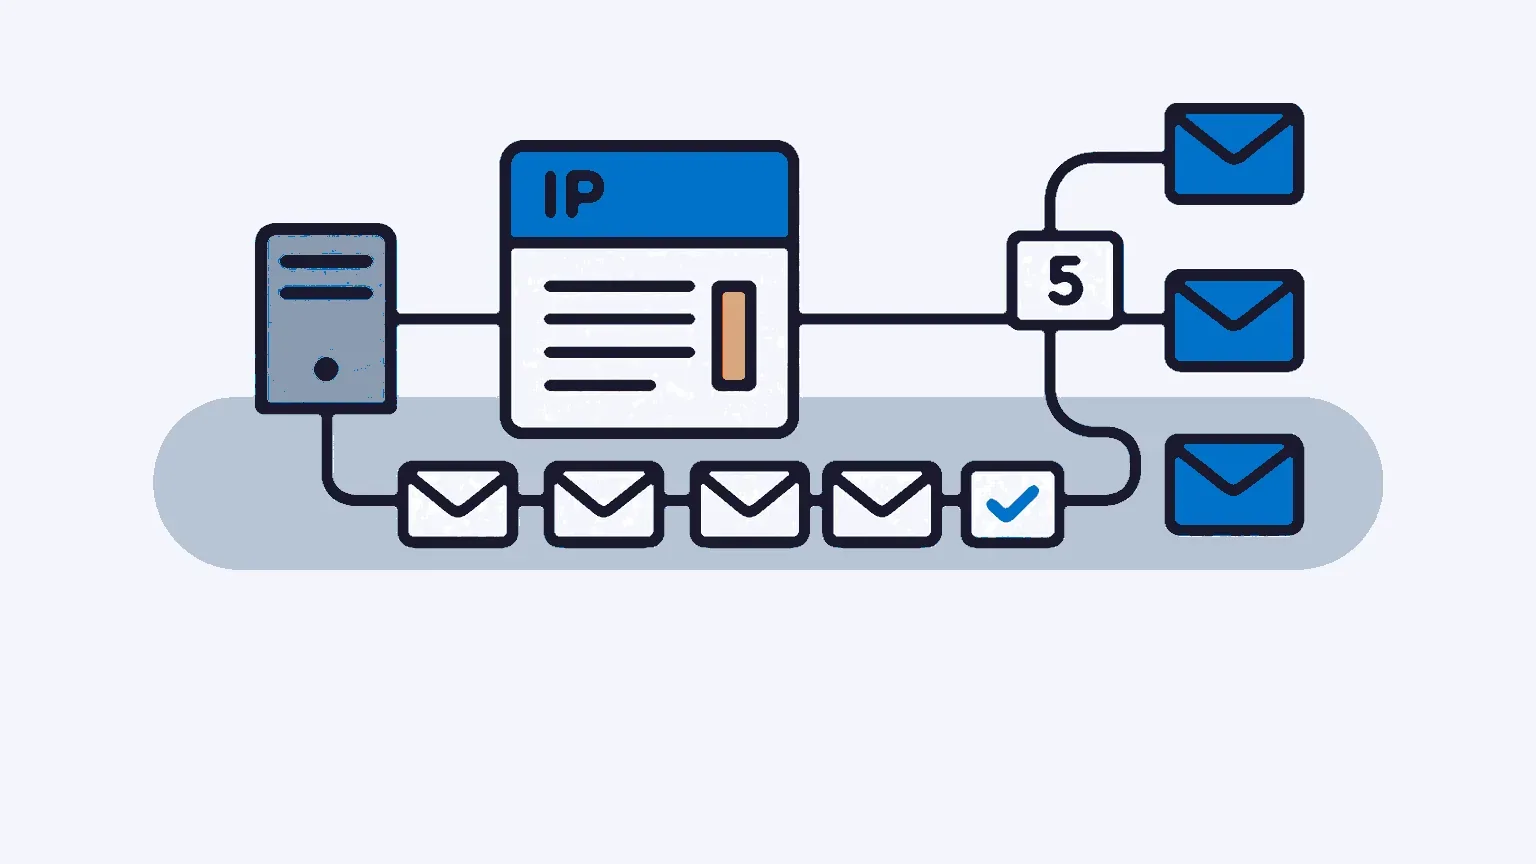
A campaign shows 98% deliverability. The figure is reassuring, and it is usually accurate. Yet it does not say what most marketers think it says: that 98% of recipients found the message in their inbox.
The number answers a narrower question. Did the recipient’s server accept the message? What happens next, whether it lands in the inbox, the spam folder or a corporate quarantine, is entirely outside its scope. EmailToolTester, which tests the major email platforms every year, measured an average of 83.1% of emails reaching the inbox in 2026, with 10.5% filtered as spam and 6.4% simply nowhere to be found. So there is a blind spot between the rate you see and the rate that matters. Here is how to measure it, and then how to shrink it.
Deliverability rate: definition and formula
As platforms calculate it, the deliverability rate is the number of emails accepted by receiving servers divided by the number of emails sent.
Deliverability rate = (emails sent − bounces) ÷ emails sent × 100
Take 10,000 sends. 180 addresses no longer exist, and 120 messages are still refused after every retry. That leaves 9,700 emails accepted, or 97%.
The terminology shifts from one tool to the next. Some call it the delivery rate, others the acceptance rate, and the latter is in fact the most accurate label. If the concept itself feels hazy, our definition of deliverability goes back to basics. This article is about the calculation and what it hides.
Hard bounces and soft bounces: what the formula should exclude
Competitors who publish this formula rarely settle a question that is actually simple: which bounces should you remove?
Hard bounces are straightforward. A non-existent address or a domain that has gone: the server replies with a 5xx code, which RFC 5321 defines as a permanent failure, often refined by an extended code such as 5.1.1 (unknown user). That message will never be delivered, so it comes out of the calculation.
Soft bounces are trickier. A 4xx code signals a temporary failure, such as a full mailbox or an overloaded server, and the platform tries again. If you work out your rate ten minutes after the campaign goes out, you end up counting as lost some messages that will get through an hour later. So calculate the rate once the retries are over, and apply the same rule from one campaign to the next. Otherwise the comparison is worthless.
Deliverability and inbox placement: two rates that get mixed up
The inbox placement rate measures something else: the share of messages that actually reach the inbox, as opposed to the spam or junk folder.
| Deliverability rate | Inbox placement rate | |
|---|---|---|
| Question asked | Did the server accept the message? | Does the recipient see it in their inbox? |
| Data source | SMTP responses received by your platform | Tests on seed addresses, panels, mailbox provider tools |
| Accuracy | Exact, message by message | Estimated, from a sample |
| Typical value for a healthy list | Close to 100% | Noticeably lower, and varies by mailbox provider |
The gap between the two is far from trivial. Validity’s 2025 benchmark puts average inbox placement at around 85%, which leaves roughly one legitimate email in six outside the inbox. And every one of those messages is included in your deliverability rate, because the servers accepted them before sorting them.
The practical takeaway: a high deliverability rate is a necessary condition, never proof. When a tool quotes you a rate, check what it is calculated against. Some tools express inbox placement as a share of emails sent, others as a share of emails delivered, and two figures of 90% may not be describing the same thing.
How to measure your deliverability rate, tool by tool
No single tool tells the whole story. Each one sheds light on part of the journey, and it is by cross-checking them that you get a reliable diagnosis.
Bounces and SMTP codes from your platform
This is the most reliable measure, because it is based on each server’s response. You still need to read it at the right level of detail. An overall rate of 96% can hide one mailbox provider that is falling away. In your statistics, look for the breakdown by provider: Gmail, Microsoft, Orange, Yahoo, Free. A drop confined to a single provider almost always points to a reputation or filtering problem on their side, not to a damaged list.
Look at the type of rejection too. A 5.1.1 is about the quality of your list, a 5.7.x about the recipient’s policy: missing authentication, a reputation judged insufficient, blocked content. Since May 2025, for example, Microsoft has been rejecting poorly authenticated senders of more than 5,000 messages a day with code 550 5.7.515.
Postmaster Tools and SNDS: the mailbox providers’ view
For your sending domain, Google Postmaster Tools shows the rate at which Gmail users report you as spam, the state of your authentication, delivery errors and, more recently, a compliance status against the requirements for bulk senders. The threshold to watch is well known: Google asks senders to stay below 0.10% complaints and treats 0.30% as a limit never to be reached.
On the Microsoft side, SNDS gives each sending IP a colour indicator (green, yellow or red), along with message volume and the complaint rate from Outlook.com and Hotmail users, updated daily. You need your own IPs to make use of it. On a shared IP, you are reading the health of every sender using it, and your own signal gets diluted.
Neither tool gives you an inbox placement rate. What they show is how mailbox providers perceive you, which explains a good deal of the variation in placement before it happens. This is where your domain reputation shows up, well before campaign figures take a dive.
Seed list placement tests
A seed list is a set of test addresses held with the main mailbox providers. You add it to your send, and the testing tool records where each message lands. It is the only method that produces an inbox placement figure for a specific campaign.
It has two limitations that are easy to forget. These mailboxes have no engagement history, whereas Gmail and Microsoft both weight their filtering according to how each recipient actually behaves. And in B2B, they do not pass through corporate security gateways. Supplement them with a few real business addresses, in your own company or at partners running Microsoft Defender, Proofpoint or Mimecast: they will often teach you more.
DMARC aggregate reports
The rua= tag in your DMARC record, defined by RFC 7489, brings in daily reports sent by mailbox providers. They tell you nothing about placement. What they do list is every source sending on behalf of your domain, with the SPF and DKIM result for each one.
This is where you discover the CRM sending its follow-ups without a DKIM signature, or the invoicing tool that was left out of the SPF record. These poorly authenticated streams weigh on the reputation of the whole domain, campaigns included.
Open rate: a broken thermometer
For a long time, deliverability was monitored through the open rate: a sudden drop meant you had slipped into spam. The method has lost much of its value. Apple Mail accounted for 51.5% of the opens measured by Litmus in February 2026, and its privacy protection preloads images, and therefore the tracking pixel, whether or not the message is read. An inflated open rate can mask a genuine decline in placement.
There is also a new legal framework. Since the recommendation published on 14 April 2026 by the CNIL, the French data protection authority, tracking opens at an individual level requires consent in principle. Individual deliverability measurement, used to identify and remove inactive addresses, remains exempt, provided it is used for that purpose alone.
Keep opens as a secondary signal, read by mailbox provider and compared with your own previous campaigns. Clicks remain a better indicator, allowing for the gateway bots that test links before the recipient does.
What drags the rate down, especially in B2B
The usual causes are well known, and our B2B email deliverability guide covers them one by one. Three of them have a direct effect on both rates.
Authentication first. Google, Yahoo and then Microsoft now require bulk senders to have SPF, DKIM and a published DMARC policy. A domain that is not compliant first gets filtered as junk, then rejected.
List quality next. In B2B, an address dies when the employee leaves the company. A file that has not been used for a year comes back full of hard bounces, and a few sends like that are enough to damage an IP’s reputation.
Reputation last, built from your complaints, your engagement and how consistent your volumes are. A spike in sending to a cold segment can tip it over within days.
B2B adds a filter that consumer-focused guides overlook: the security gateway of the recipient’s company. It accepts the message, tells the sending server it has been received, then quarantines it according to its own rules. For your platform, that email has been delivered. For your prospect, it does not exist. Shortened links, a tracking domain shared with other senders or an attachment are sometimes enough to trigger this silent sorting.
Action plan: raising a rate from 80% towards 99%
A deliverability rate of 80% is not a lost cause. It almost always signals a specific problem, which you isolate by starting from the symptom.
| Symptom | Where to see it | Action |
|---|---|---|
| Rising hard bounces | Bounces per campaign | Remove invalid addresses, check the file before any import |
| 5.7.x rejections | SMTP codes by mailbox provider | Check SPF, DKIM, DMARC alignment and reverse DNS |
| Complaints above 0.10% | Postmaster Tools, feedback loops | Tighten targeting, space out sends, offer one-click unsubscribe |
| Drop at a single mailbox provider | Statistics broken down by provider | Reduce volume to that provider, target active contacts first |
| Emails delivered but never read | Test addresses inside companies | Review links, tracking domain and attachments |
The sequence that works always follows the same order.
- Diagnose by mailbox provider. A global problem and a local one are not handled the same way.
- Clean the list. Remove hard bounces and addresses that have shown no response for several months. A shorter list that engages is worth more than a long one that complains.
- Put authentication back in order. DMARC reports reveal the streams that were forgotten.
- Build volume back up gradually. Start with your most engaged contacts, then widen in stages.
- Check every week. Postmaster Tools, SNDS and your per-provider statistics, always with the same calculation rule.
Keeping up that routine without spending a morning in exports takes statistics you can read at a glance. Ediware campaign reporting breaks down the acceptance rate, hard and soft bounces and complaints by mailbox provider, and automatically removes hard bounces from your lists. With dedicated IPs, included from the PRO plan, the SNDS and Postmaster Tools indicators reflect your sends alone.
Frequently asked questions about deliverability rate
What is a good deliverability rate?
On a well-maintained list, the rate of acceptance by servers comes close to 100%: every point lost corresponds to invalid addresses or rejections. For inbox placement, EmailToolTester considers 89% a good result and 95% an excellent one. Above all, compare your campaigns with each other, one mailbox provider at a time.
How do you calculate a campaign’s deliverability rate?
Subtract bounces from the number of emails sent, divide by the number of sends, then multiply by 100. With 10,000 sends and 300 bounces, the rate comes to 97%. Do the calculation once soft bounce retries are finished, otherwise you will count as lost some messages that are still on their way.
What is the difference between delivery and deliverability?
Delivery, sometimes called acceptance, means the receiving server has taken the message. Deliverability, in the strict sense, means it has reached the inbox, which is why many prefer the term inbox placement. Plenty of platforms display a delivery rate labelled as deliverability, hence high figures that do not guarantee anyone reads it.
How can I tell if my emails are going to spam?
Run a seed list placement test, which records where each message lands with the main mailbox providers. Add Google Postmaster Tools for your complaint rate, and a few real business addresses protected by a security gateway. A drop in opens confined to a single provider is also a warning sign.
Why is my deliverability rate good when my clicks are falling?
Because servers can accept a message and then file it as spam or quarantine it. Your platform counts it as delivered, yet the recipient never sees it. Check your complaint rate, your authentication and your results by mailbox provider before you start questioning the content of the campaign itself.
How often should you measure deliverability?
Read bounces and rejections after every campaign. Google Postmaster Tools and Microsoft SNDS deserve a weekly look, because reputation deteriorates gradually and their charts show it before your statistics do. Keep full placement tests for significant changes: a new domain, a new IP, a rise in volume or an unexplained drop.
Related articles
Quishing: the QR code threat in emailing
Quishing is phishing by QR code: the malicious link hides inside an image, slips past classic anti-spam filters and puts your B2B deliverability at risk.
6 min read Deliverability & technicalEmail accessibility: 2025 compliance
The European Accessibility Act has applied since 28 June 2025. What it really changes for B2B senders, and how to bring your campaigns into compliance.
8 min read Deliverability & technicalSender reputation: the key factor in your deliverability
Sender reputation decides whether your emails land in the inbox or in spam: here is how to measure it, protect it and rebuild it when it has been damaged.
7 min read Deliverability & technicalMicrosoft tightens its email rules in 2025: what changes for B2B senders
Since 5 May 2025, Microsoft requires SPF, DKIM and DMARC from any domain sending over 5,000 emails a day to Outlook.com, Hotmail.com and Live.com.
9 min read