In marketing, the talk of loyalty has been around for a long time, yet most budgets are still spent on acquisition. According to several studies, winning a new customer costs “five to seven” times more than keeping an existing one. And this difference has widened even further as media buying costs and online competition soar.
But the value isn’t just economic: a customer who has returned after a voluntary departure often has an average basket 10-20% higher than the cohorts who have remained loyal, because they have compared your offer with that of competitors. In this article, we take a look at concrete ways to turn churn into a revenue channel:
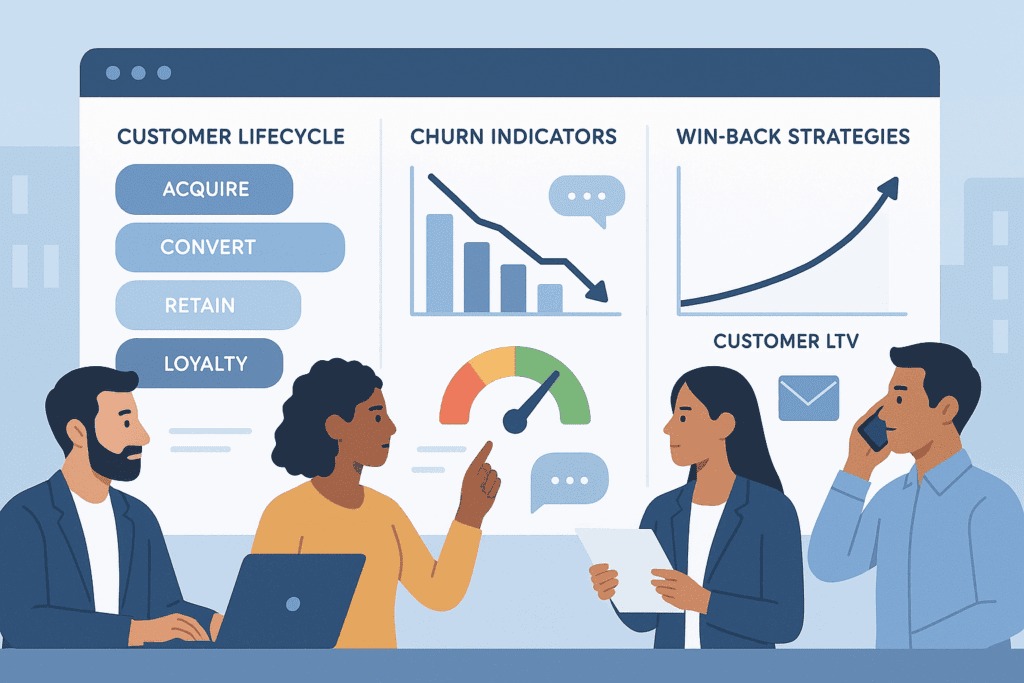
- Mapping the customer lifecycle.
- Detect signals of discontent.
- Understanding the causes of churn.
- Build a profitable win-back strategy.
- Measure and automate to sustain results.
1. Mapping the customer lifecycle: prevention rather than cure
Real prevention starts with a detailed mapping of the entire customer journey, from the first visit to the post-cancellation repurchase. Take a SaaS vendor:
At each of these stages, a specific health signal is monitored:
| Step | Critical signal | Usual tipping point |
|---|---|---|
| Discover | bounce rate & scroll | > 65% bounce rate indicates poor targeting |
| Free trial | activation rate (key function executed) | < 20% ⇒ need guided onboarding |
| Initial subscription | weekly frequency of use | < 1 session/week after 30 days = latent risk |
| Upmarket | adoption of new features | stagnation > 90 j suggests a lack of perceived value |
| Renewal | average support response time | > 12 h ? service perception deteriorates |
| Reconquest | time since cancellation | > 6 months: more costly recontact, segmentation required |
To avoid multiplying isolated alerts, companies weight these indicators in a health score. The principle: each metric is normalized (0-100), then weighted according to its proven influence on retention (by logistic regression or simple empirical calculation). For example: 30% frequency of use, 25% activation of new features, 20% speed of support, 15% NPS (Net Promoter Score or Customer Satisfaction Index), 10% up-to-date invoicing.
When the score drops below the critical threshold (often 60/100), a workflow is triggered: in-app tutorial, proactive call to the CSM, or free upgrade offer. Stripe reports that it has reduced its voluntary churn by 14% by intervening only when the score falls below 55, rather than flooding all customers with generic reminders.
In short: map, choose a single pilot indicator for each stage and aggregate everything into a single score. It’s this combination that turns winning back customers from a “plan B” into an automatic, measurable reflex.
2. Detect the weak signals of an unhappy customer
Dissatisfaction never explodes without warning; it first rustles around quietly. On an e-commerce site, we’ll see: an increase in “product return” filters, fewer finalized shopping baskets, or an NPS (Net Promoter Score or Customer Satisfaction Index) score halved after an interface redesign.
To capture these clues :
- Centralize CRM and customer service: calls, chats, tickets and tweets in a single file.
- Launch post-purchase micro-surveys (two questions are enough).
- Analyze tickets semantically; the rise of the words “too expensive”, “disappointed”, “bug” triggers an alert.
A response within 24 hours to a public complaint halves the probability of departure. The faster the response, the cheaper the subsequent win-back.
2. Detect the weak signals of an unhappy customer
A customer never slams the door without first leaving their mark. On an e-commerce site, these traces can take the form of a product return rate that climbs two points, an add-to-cart rate that stagnates while traffic increases, or an NPS (Net Promoter Score or Customer Satisfaction Index) score that halves after an interface redesign. It’s often a drop in time spent on the app or an explosion in tickets – a sign that onboarding has not been understood.
There are three steps to transforming this background noise into a usable alert:
-
Unify relational data
E-mails, calls, chats, tweets, in-app surveys: everything must converge towards the same contact record in your CRM. Without this 360° vision, you run the risk of treating each interaction as an isolated incident, when in fact it’s the same annoyance that’s escalating. -
Install an ultra-light post-purchase thermometer
A micro-survey of two questions (satisfaction + main reason for rating) triggered 24 hours after delivery is enough to take the temperature. The response rate exceeds 35% when the questions fit on a single mobile screen – enough to constitute a representative sample without creating customer fatigue. -
Screen tickets semantically
A simple model (sentiment analysis + keyword detection “too expensive”, “disappointed”, “bug”) classifies messages by degree of urgency. As soon as a ticket crosses the critical threshold, it goes into priority queue and a Customer Success Manager receives a Slack notification.
Measured impact: responding publicly (networks, reviews) within 24 hours halves the risk of leaving at the next renewal. At one telecom operator, the churn rate for customers who received a response in less than an hour fell from 3.2% to 1.5% over the following quarter.
4. Build a win-back strategy focused on value, not automatic discounting
Winning back a customer is not a matter of last-chance spam. It’s the work of a surgeon: understanding the pain that led to the departure, responding to it credibly, then proving that the perceived value once again exceeds the cost. The method is built around four pillars – segmentation, message, orchestration, framing – illustrated below by the real-life case of a French telecom operator.
4.1 Segment ex-customers finely
The database of 12,000 quarterly cancellations was first enriched by CRM: declared reasons for leaving, call history, level of seniority, average basket. Three groups emerged:
-
Price seekers: leaving after a price increase.
-
Functional disappointments: recurring technical problems, network speed or coverage.
-
Silent inactives: low usage over the last six months, no complaints.
Why this granularity? Because successful win-back campaigns achieve return rates of between 20% and 30% only when the message matches the real motivations for leaving.
4.2 Adapt the message rather than “throw away” a discount
-
Locked-in price for 12 months for price seekers, accompanied by an unbiased comparator showing the savings achieved.
-
Video demonstration of new features (Wi-Fi 6, instant e-SIM) for the functionally disappointed, with an invitation to a technical webinar.
-
Personalized summary of loyalty points and unused data for inactive customers: a reminder of the dormant value they leave on the table.
The content is first sent by rich email; if there is no click within 72 hours, an SMS summarizes the offer in one sentence, then an advisor calls as a last resort. This multi-channel orchestration meets the responsiveness expectations of consumers, 79% of whom want feedback within 24 hours on digital networks and channels.
4.3 Frame the offer to keep it profitable
Marketing capped the discount so that it never exceeded the average margin recovered in six months. The result: no margin-destroying windfall effects, and a clear business model for the finance department.
4.4 Measure the impact, not just the number of accounts reopened
-
Reactivated accounts: 2,430 (20% of target base).
-
Incremental annual income: €1.3 million, or 8% of monthly net sales.
-
Negative rebound (< 90 days): 9%, proof that the value proposition is now aligned.
The lesson to be learned: an effective win-back strategy is more than just “20% off for everyone”. It begins with a diagnosis, continues with a hyper-contextualized discourse, is executed in a multi-channel sequence, then piloted on a dedicated P&L to verify that we are creating – and not destroying – value.
5. Measuring success: more than just a “reopened account
Counting gross reactivations is tempting: the higher the number, the more successful the operation. But this is an optical illusion. A win-back campaign is only profitable if the returned customer stays long enough to cover, then exceed, the cost of winning back. Two indicators make the difference:
-
The “LTV prime” (LTV)
We calculate the lifetime value of the customer after his return, over twelve months, and compare it with the total cost of the campaign that reached him (creative, routing, incentive, human time). In the case of the telecom operator, each customer won back generated an average of €167 in margin over the following year, compared with €145 for a subscriber who had never left: win-back therefore creates +€22 in net value per customer.LTV ( Lifetime Value )-sometimes called Customer Lifetime Value (CLV)-represents the total net revenue a customer generates for the company over the entire duration of the relationship.
-
The negative bounce rate
This is the proportion of customers who have been won back but cancel again within 90 days. Above 15%, it’s a sign of a poorly calibrated offer: we’ve bought short-term numbers, not fixed the root cause. In our example, the negative bounce is capped at 9%, so the value proposition has really evolved, not just been “sold off”.
To keep track of these two metrics without getting lost, a monthly dashboard is all you need: line up the number of accounts reactivated, the revenue streams generated month by month and, opposite, the cumulative acquisition costs specific to the campaign. After three months, you can see whether the cumulative margin curve exceeds the cost curve; after twelve months, you can confirm structural profitability.
In practice
If LTV falls below the level of a customer who has never left, reduce the discount and step up onboarding.
If the negative bounce exceeds 15%, go back to the post-subscription interviews: your product still doesn’t solve the pain you’ve expressed.
Measuring win-back in this way turns a marketing “hit” into a measurable financial asset. You’ll know exactly when to speed up – or slow down – your win-back programs, and you’ll be able to demonstrate that, when properly managed, win-back can cost less and yield more than traditional acquisition.
All in all
Attrition is not just a “product problem”: it’s a symptom of a punctual misalignment between promise and experience. By mapping the customer lifecycle, tracking the whispers of the dissatisfied customer, identifying the mechanics of customer churn and then deploying a scripted and measured customer win-back program, the company can transform a leak into a source of growth.
Winning back customers requires rigor, speed and personalization, but it’s always cheaper than convincing a stranger. The next time your dashboard reports an increase in unsubscribes, think of it as a dormant portfolio of opportunities, ready to be awakened by the right conversation, at the right time.

